
How to Measure SaaS Design Impact for Sustainable Growth
Every ambitious SaaS team faces questions about which metrics truly reflect growth and value. For product managers and CTOs aiming to connect design decisions to business impact, the difference between surface-level numbers and actionable metrics can shape a company’s future. Focusing on measurable KPIs like activation rate, net promoter score, and engagement score reveals how design changes drive real gains in user activation and long-term revenue. Stay ahead by building a metric framework that fuels smarter decisions and lasting results.
Table of Contents
- Step 1: Define Key Business And User Metrics
- Step 2: Align Design Initiatives With Strategic Goals
- Step 3: Collect And Analyze Relevant Data
- Step 4: Validate Impact With Actionable Insights
Quick Summary
| Key Message | Explanation |
|---|---|
| 1. Define key business and user metrics | Establish metrics that matter to your business goals. This enables tracking design impacts effectively. |
| 2. Align design initiatives with strategic goals | Ensure design work supports company objectives to maximize impact and resource utilization. |
| 3. Choose actionable metrics over vanity metrics | Focus on metrics that influence business decisions, like Customer Acquisition Cost, rather than superficial measures. |
| 4. Create baseline measurements for comparison | Record current performance before design changes to accurately assess impact after implementation. |
| 5. Extract actionable insights from collected data | Transform data findings into specific recommendations for design improvements and business growth. |
Step 1: Define key business and user metrics
You cannot improve what you don’t measure. Before making any design decisions, you need to establish which metrics actually matter to your business and your users. This step transforms vague goals like “improve user experience” into concrete, trackable numbers that reveal whether your design work is creating real impact.
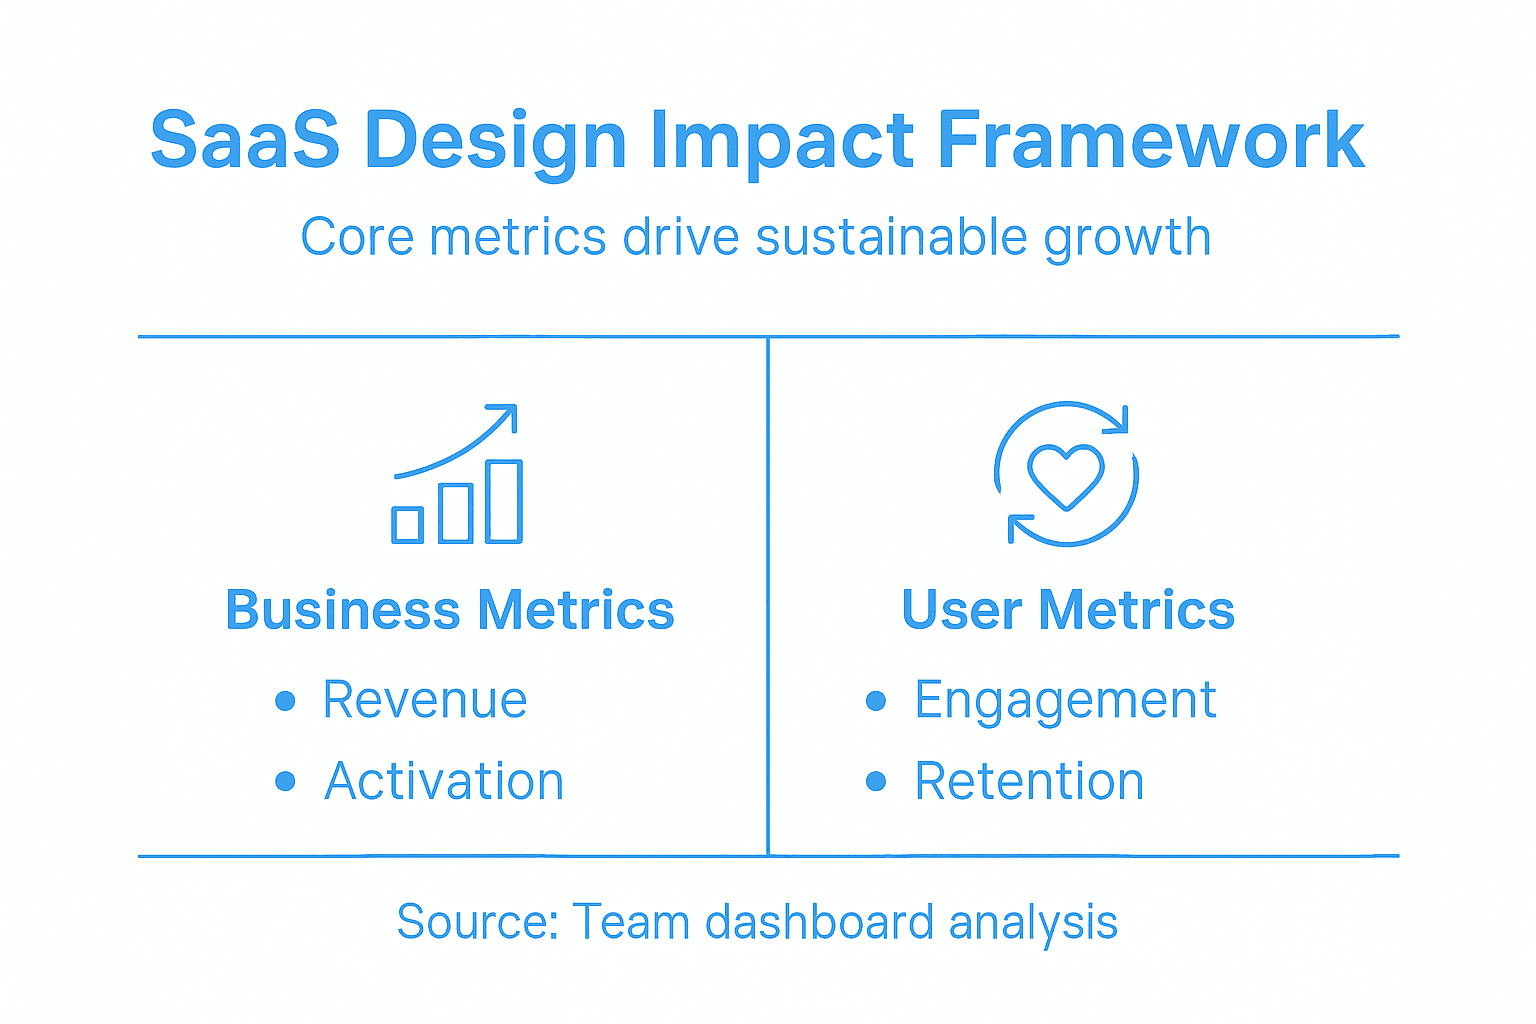
Start by identifying business metrics that connect directly to revenue. These are the numbers your CEO cares about: monthly recurring revenue growth, customer acquisition cost, customer lifetime value, and net revenue retention. Then layer in user-focused metrics that show whether people are actually finding value in your product. Think activation rate (users completing core actions), engagement scores, feature adoption rates, and churn indicators.
Essential SaaS metrics like monthly unique visitors, net promoter score, and customer engagement scores provide insights into how your design impacts marketing, sales, product development, and customer success across the entire business.
Here’s how to build your metric framework:
Here’s a quick reference comparing common SaaS business and user metrics:
| Metric Type | Example Metric | What It Measures | Business Impact |
|---|---|---|---|
| Business | Customer Acquisition Cost | Cost to gain a new customer | Defines profitability and marketing efficiency |
| Business | Net Revenue Retention | Revenue retained from existing customers | Gauges overall growth and retention health |
| User | Activation Rate | Core actions completed by users | Reveals onboarding effectiveness |
| User | Feature Adoption Rate | Rate of new feature usage | Indicates product value and innovation success |
| User | Churn Rate | Percentage of users leaving | Measures customer satisfaction and loyalty |
- Map metrics to design goals. If you redesigned your onboarding flow, track activation rate and time-to-first-value. If you simplified a dashboard, measure engagement time and feature discovery.
- Choose actionable metrics over vanity metrics. CAC payback period tells you something; total signups tells you less. Focus on numbers that directly influence business decisions.
- Tailor metrics to your growth stage. Early-stage SaaS prioritizes activation and retention. Growth-stage companies care more about expansion revenue and net revenue retention.
- Create baseline measurements. Before launching a design change, record current performance. You need “before” data to measure “after” impact.
Tracking core metrics matched to your growth stage helps you predict revenue accurately, make smarter operational decisions, and speak credibly with investors.
The metrics you choose become your design team’s language. When everyone aligns on what success looks like, design stops being subjective and starts being strategic. Your product manager no longer asks “does this look better?” They ask “did activation rate improve?”
Pro tip: Start with five to seven core metrics maximum. Too many metrics create noise and dilute focus. Pick the ones that directly link to your biggest growth bottleneck right now, then add more only when you’ve proven impact on those first few.
Step 2: Align design initiatives with strategic goals
Design work that ignores company strategy becomes noise. This step ensures every design project you pursue directly supports your business objectives, preventing wasted effort and keeping your team focused on what actually moves the needle.
Start by understanding your company’s strategic priorities for the next 12 months. Is your goal to increase activation rates? Reduce churn? Expand into new markets? Every major initiative should ladder up to one of these priorities. Your design work must connect visibly to these objectives, not exist in a vacuum.
Goal alignment ensures every level of work supports overarching business objectives, which means teams work cohesively, projects finish on schedule, and resources deliver maximum impact. When design initiatives align with strategy, motivation increases, decision-making improves, and duplication disappears.
Here’s how to create this alignment:
- Map each design project to a strategic goal. Before starting any design work, write down which business objective it supports. If it doesn’t connect to strategy, reconsider whether you should build it.
- Involve stakeholders early. Your CEO, product leader, and engineering lead need to agree that this design work matters strategically. Misalignment at this stage wastes months.
- Create a shared document. List your top strategic goals alongside the design initiatives supporting them. This becomes your north star when priorities shift or resources get tight.
- Review quarterly. As strategy evolves, revisit your design roadmap. Some projects may no longer align with where the business is heading.
When your design team understands how their work connects to revenue growth, retention, and market position, they stop designing for aesthetics and start designing for business outcomes.
Alignment transforms design from a cost center into a strategic function. Your design director can now sit in strategy meetings as a peer contributor, not just an executor. Your product manager sees design as integral to hitting targets, not optional polish.
Pro tip: Create a simple one-pager that maps your top three strategic goals to corresponding design initiatives. Share it monthly with leadership and use it to defend scope when new requests appear. This document keeps everyone honest about priorities.
Step 3: Collect and analyze relevant data
You’ve defined metrics and aligned initiatives. Now you need actual data to measure whether your design changes work. This step involves gathering information through structured methods, organizing it properly, and extracting meaningful insights that reveal design impact.
Start by choosing your data collection methods. Different questions require different approaches. User behavior inside your product? Use analytics tracking. Understanding why users struggle? Conduct user interviews. Testing a specific hypothesis? Run an A/B test with your redesigned onboarding flow.

Collecting data involves implementing a planned approach using methods such as observations, surveys, interviews, and experiments. Organizing and recording data accurately is essential for effective analysis that produces meaningful conclusions about what’s working and what needs improvement.
Here’s your data collection and analysis workflow:
Below is a summary table outlining key data collection methods and their unique strengths:
| Method | Data Type | Best For | Limitations |
|---|---|---|---|
| Analytics Tracking | Quantitative | User behavior, trend analysis | Lacks detailed user motivations |
| Surveys | Quantitative & Qualitative | Satisfaction, opinions, broad reach | Can be biased or shallow |
| Interviews | Qualitative | Deep user insights, feedback | Time-consuming, limited sample size |
| A/B Testing | Quantitative | Measuring effect of changes | Requires enough traffic for significance |
- Choose your methods. Decide between quantitative (analytics, A/B tests, surveys) and qualitative (interviews, user testing, feedback) data based on what you need to learn.
- Set up tracking. Instrument your product to capture the metrics you defined earlier. Tag events properly so you can distinguish between user segments.
- Collect systematically. Run your data collection for long enough to reach statistical significance. A one-week A/B test won’t reveal much about activation trends.
- Organize carefully. Structure your data so it’s easy to analyze. Sloppy data entry creates analysis nightmares later.
- Analyze and code. Look for patterns in quantitative data. With qualitative feedback, code responses into themes so you can count them and spot trends.
The difference between data and insight is analysis. You can track 50 metrics, but only a handful will tell you whether your design actually moved the business forward.
Analysis transforms raw numbers into stories. When activation rate increased 23% after your redesign, that’s not luck. When users now discover the collaboration feature within their first session instead of week three, that’s design impact. Your data should prove these stories.
Pro tip: Set up a shared dashboard that updates weekly, not a static report you build monthly. When everyone on the team sees activation rates and feature adoption in real time, you shift from reactive reporting to proactive optimization.
Step 4: Validate impact with actionable insights
Raw data tells you what happened. Actionable insights tell you what to do about it. This step transforms your numbers into clear, specific guidance that your team can act on immediately to improve design and grow the business.
Start by asking the right questions of your data. Did activation rate increase? Good. But why? Did certain user segments activate faster than others? Did they spend more time in specific features? These questions lead you from observations to understanding.
Actionable insights from data provide clear, practical guidance to improve product performance, user satisfaction, and business growth. Effective insights are specific, measurable, and connected to your strategic objectives, enabling teams to make informed changes and continually refine strategies using data-driven approaches.
Here’s how to extract actionable insights from your data:
- Separate signal from noise. You tracked 40 metrics. Which five actually moved because of your design change? Focus on those. Ignore vanity metrics that look good but don’t predict business outcomes.
- Look for patterns across segments. Did Enterprise customers respond differently to your redesign than Small Business users? Did mobile users have different activation paths than desktop users? These patterns reveal opportunities.
- Connect insights to your strategic goals. “Activation rate increased 23%” sounds good. “Activation rate increased 23%, reducing time-to-first-value from 8 days to 5 days, which directly supports our retention goal” is actionable and tied to strategy.
- Identify what’s still broken. Some metrics improved. Others didn’t. That’s where your next design iteration lives. Users still take 12 clicks to reach the collaboration feature? That’s your next insight to act on.
Insights without action are just observations. The moment you decide to change something based on what your data revealed, you transform measurement into continuous improvement.
Your insights should spark immediate conversations. When you tell your product lead that new users who complete onboarding in one session become paying customers at 3x the rate, suddenly onboarding design becomes non-negotiable. Data gives design authority.
Pro tip: Write a one-paragraph insight summary for each major metric. Start with the finding, then explain why it matters, then specify exactly what you recommend changing next. This format forces clarity and prevents insights from getting lost in dashboards.
Unlock True SaaS Growth with Strategic Design Impact
Measuring the impact of your SaaS design efforts is essential to avoid wasted resources and unlock sustainable growth. The challenge many SaaS companies face is moving beyond surface-level metrics and design aesthetics to truly track activation rates, feature adoption, and net revenue retention as proven indicators of success. Without clear alignment between design initiatives and strategic business goals your team risks working without a roadmap to meaningful impact.
At The Good Side, we specialize in embedding experienced designers who become true partners in driving measurable growth. We help SaaS teams focus on the metrics that matter most by integrating senior design leadership with your product and engineering groups. This hands-on approach accelerates onboarding improvements and optimizes go-to-market experiences to directly influence your core business outcomes.
Experience how strategic design moves from costly execution to revenue-driving advantage.
Ready to transform your SaaS design from guesswork to data-driven success? Visit The Good Side now and discover how our fractional design partnership will empower your team to measure, analyze, and act on insights that fuel your growth.
Frequently Asked Questions
How can I define metrics to measure SaaS design impact?
To define metrics for measuring SaaS design impact, start by identifying key business metrics that relate to revenue, such as customer acquisition cost and net revenue retention. Then, layer in user-focused metrics like activation rate and churn rate. Collect these metrics and link them to desired design outcomes, ensuring they can be tracked over time.
What steps should I take to align design initiatives with my business strategy?
To align design initiatives with your business strategy, first, understand the company’s strategic priorities for the upcoming year. Then, map each design project to one of these goals to ensure they support overarching business objectives. Review this alignment regularly to adapt to any shifts in strategy or priorities.
How do I collect and analyze data to validate design changes?
To collect and analyze data effectively, choose appropriate data collection methods, such as user analytics, surveys, or A/B testing. Ensure you set up tracking to capture the defined metrics accurately and organize the data systematically. After collecting data for a sufficient period, analyze it to identify trends and insights that inform your design decisions.
What types of actionable insights can I derive from my data?
You can derive actionable insights by analyzing your metrics to discover not just what changed, but why it changed. Look for patterns across different user segments to identify specific areas for improvement. Focus on insights that directly link back to your strategic goals to inform meaningful design adjustments and prioritize your next steps.
How can I ensure my design metrics are impactful without being overwhelming?
To ensure your design metrics are impactful, limit yourself to five to seven core metrics that directly connect to your biggest growth challenges. This focused approach allows you to track significant indicators without creating confusion or diluting your efforts, enabling you to improve key aspects of your SaaS design effectively.